Coaches are always trying to find ways to force their players into competitive situations. Most teams have developed Quality At Bat charts and have ways to evaluate their defense. The more information you have to rank your players, the better chance you have to determine your optimal lineup as well as communicate with your players on what they need to work on to crack the lineup or bat higher in the order.
It can be difficult to determine such rankings for pitchers, especially when the foremost statistic is entirely misleading. Unlike batting average or fielding percentage, earned run average can be ruined in one bad outing, is dependent on uncontrollable factors such as defensive personnel, baserunning, scoring decisions, etc. ERA can also be affected when you are not even in the game (inherited runners) and can distract you from some metrics that really matter! And it works both ways––if the leadoff hitter of an inning reaches base on an error by the pitcher, and that same pitcher strikes the next two batters out and proceeds to give up ten runs after that, he will leave that inning with a zero ERA!
Depending on your preference, there are much more useful metrics that can be used to evaluate your pitching staff and teach them the importance of ‘The Process,’ because unfortunately, ERA is here to stay. Here is an example of the metrics I have used in the past for our Process Chart:
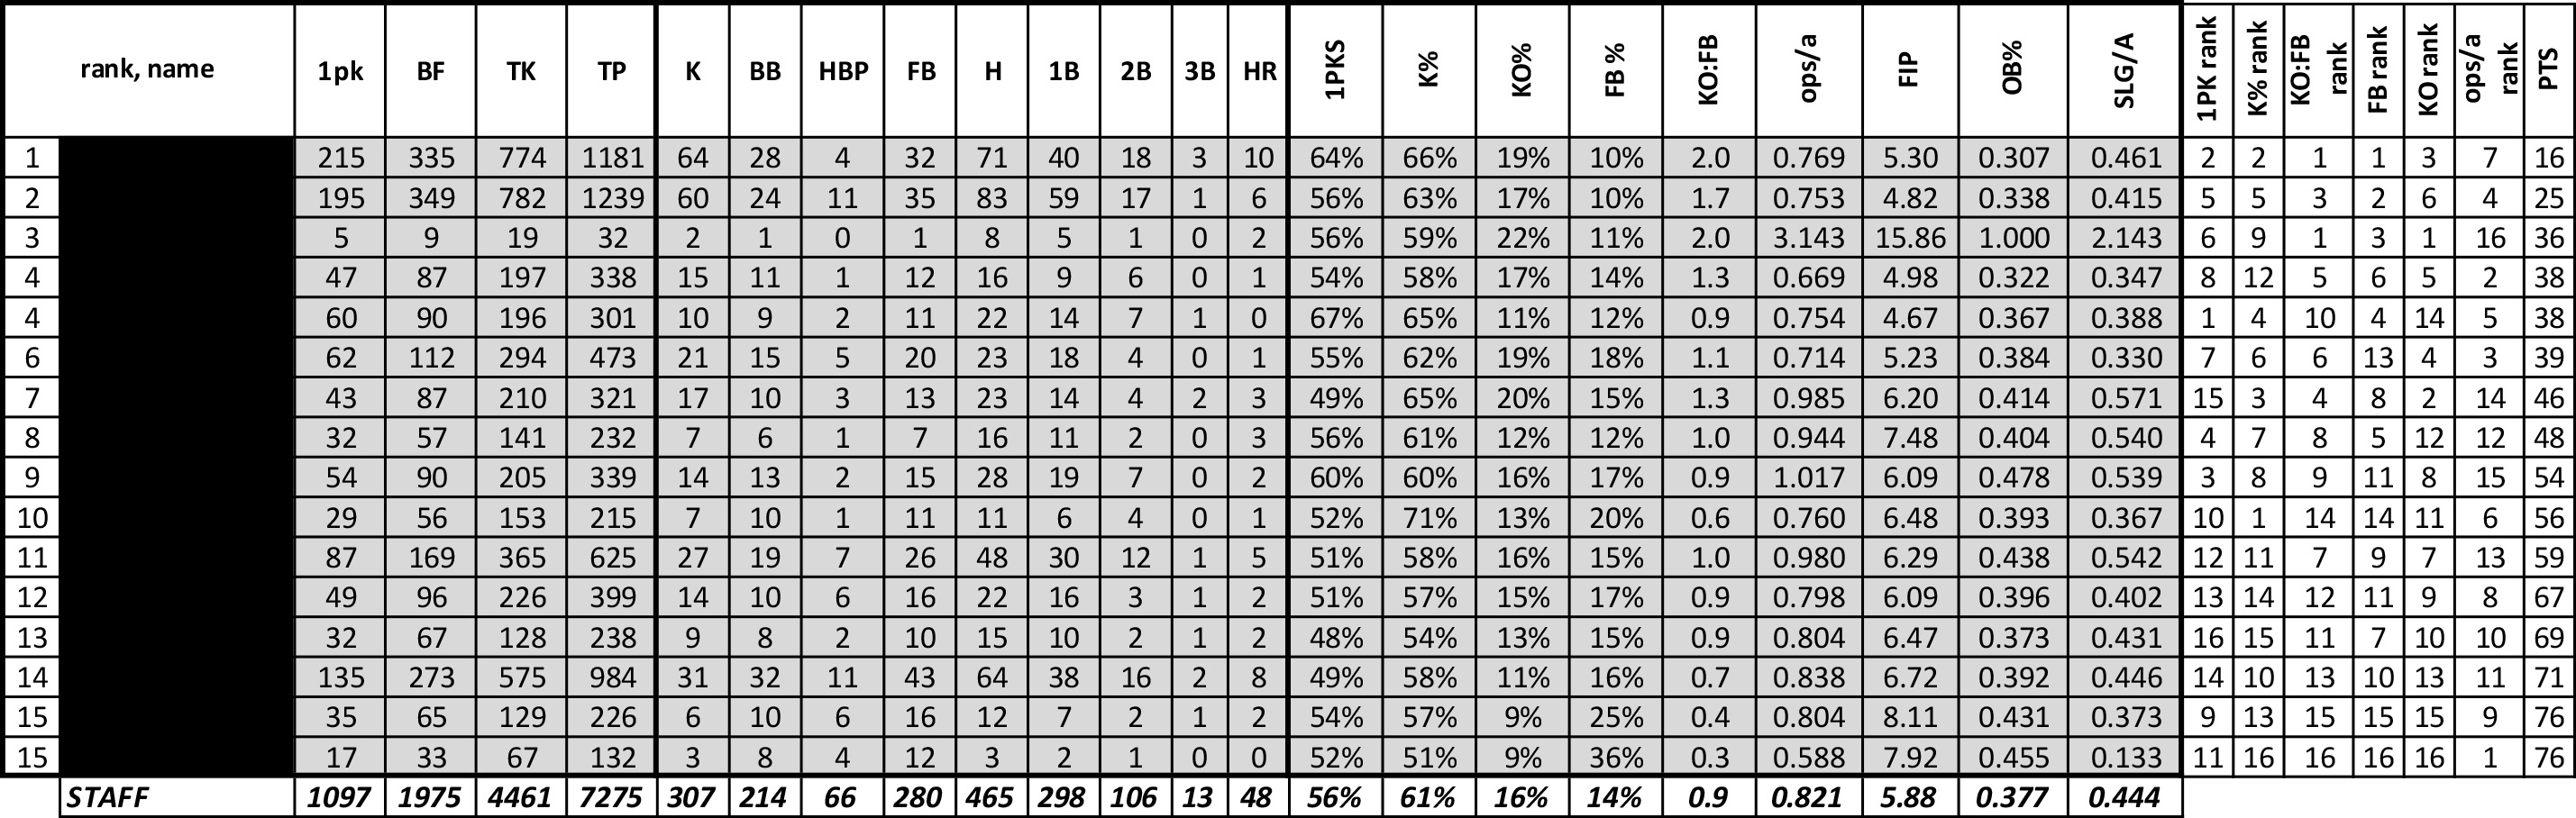
- First pitch strike percentage (above 60% is the goal, 65% is elite)
- Overall strike percentage (same as above)
- Free bases rate: batters faced divided by total walks and HBP allowed (less than 10% is good)
- Strikeout rate: batters faced divided by strikeouts (above 20%)
- Free bases:Strikeout ratio (2:1 ratio is good, 3:1 is elite)
We have also used Fielding Independent Pitching, opponent on base percentage, and opponent slugging percentage to compare and rank our pitching staffs. These formulas can be plugged in to an Excel document to make the leg work easier, along with the RANK tool that Excel has.
You can come up with ‘process rankings’ for your pitcher by giving them each a rank in each of the categories that you value. In this case, we mentioned eight values, so if you had a pitcher ranked first, fourth, tenth, sixth, fifth, fourth, ninth and fifth, you would add those numbers up to get a total of 44. The lower the number, the better the rank, so clearly you would want to SORT (another Excel tool) those totals and determine your overall process winner. Once you have developed any sort of sample size with this, you will begin to see the separation between your pitchers, have a chance to start to assign roles, and identify some clear goals for your staff to work on, both individually and as a whole.
Once you have gathered the data that you determine is important, make sure you have a good charting system to ensure that your numbers are accurate. The last thing you want is a host of errors when you are tracking something like this, as it can largely determine who you use in given situations. I recommend updating the Process Chart on a weekly basis and posting it for your pitchers. It’s not something I wanted to constantly pound them over the head with, as you never want them to get to a confusion state where they’re thinking about anything chart-related factors when they should be focused competing. Nowhere on this chart does it have ERA, velocity, horizontal break or spin rate, by the way! This chart can and should be kept during the season, but it is extremely useful to have in preseason preparation. If your teams intrasquad or play exhibition games, make sure you have a way to track ‘the process.’ Knowing who your top 2-3 pitchers are is easy, and sorting out the next five to six is difficult. However with the aforementioned information can give you an edge on this.